Maritime transport lost momentum in 2018, as world seaborne trade volumes rose by only 2.7% compared with 4.7% in 2017, and port container traffic grew by 4.7%, two percentage points less than the year before, according to a new report from the United Nations Conference on Trade and Development (UNCTAD).
Since 2013, growth in seaborne trade has been relatively sluggish, as compared to the aftermath of the 2009 financial crisis, when annual growth rates ranged between 4.4% and 7%, said the 2019 Handbook of Statistics.
Nevertheless, in 2018, world seaborne trade volumes rose to a new all-time high of 11 billion tons, the report noted. Global container port traffic registered at 793 million TEUs.
Asia was by far the largest trading region. In 2018, some 4.5 billion tons of goods were loaded, and 6.7 billion tons unloaded in Asian seaports. The other continents registered less than half of these amounts.
Of the 11 billion tons shipped internationally in 2018, about 7.8 billion tons were classified as dry cargo. Crude oil, the most transported cargo in the 1970s, has lost market share over the last four decades, and by 2018 it accounted for less than one fifth of the goods delivered by sea.
In 2018, developing economies still accounted for the largest share of global seaborne trade, both in terms of exports (goods loaded) and imports (goods unloaded). They loaded 59% and unloaded 64% of the world total.
With a volume of 4.2 billion tons loaded and 5.9 billion tons unloaded, Asian and Oceanian developing economies together accounted for most of that share.
The contribution of developing economies to world maritime exports has declined slightly over time, while their share of imports has risen.
The declining contribution of seaborne trade exports and increasing contribution of seaborne trade imports has led to a steady reduction of the developing economies’ trade balance. As a result, in 2014 they switched from net exporters into net importers. In absolute terms, their balance changed from a surplus of 896 million tons in 2008 into a deficit of 623 million tons in 2018.
Over the same time period, transition economies recorded an increase in their surplus from 343 million tons to 627 million tons. For developed economies, the deficit of 1.3 billion tons recorded in 2008 has fallen. In 2018, they loaded and unloaded an equal volume of goods at their seaports.
UNCTAD’s 2019 Handbook of Statistics depicts major trends in statistics relevant to international trade and development, summarizing the broad spectrum of statistics maintained in the online database UNCTADstat.
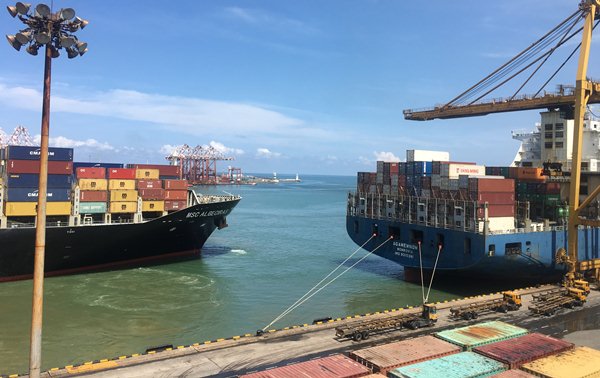
Photo by Nilantha Ilangamuwa


