
The World Trade Organization’s (WTO) sixteenth monitoring report on Group of 20 (G20) trade measures, issued recently, shows that the number of trade-restrictive measures applied by G20 economies remains high, despite a slight decline against the previous period. This is of particular concern given the continuing global economic uncertainty and the WTO’s recent downward revision of its trade forecasts.
A total of 85 new trade-restrictive measures were implemented by G20 economies during the review period (mid-May to mid-October 2016). This is an average of 17 new measures per month, down from 21 per month imposed in the previous reporting period (mid-October 2015 to mid-May 2016). This slight decline represents a return to recent trend levels after a peak in the first half of 2016. The number of new measures remains high and the rollback of existing trade-restrictive measures continues to be slow. In addition, the rate of trade facilitating measures applied each month declined against the previous period, and remains considerably below the 2009-2015 trend.
The steady accumulation of trade-restrictive measures since the financial crisis has gradually increased the share of global trade affected by such restrictions. As of the most recent reporting period the share of world imports covered by import-restrictive measures implemented since October 2008 and still in place is 5% and the share of G20 imports covered is 6.5%.
Commenting on the report, WTO Director-General Roberto Azevêdo said:
“The continued introduction of trade-restrictive measures is a real and persistent concern. Tangible evidence of G20 progress in eliminating existing measures remains elusive.
“It is clear that the financial crisis has had a long tail and that the world economy remains in a precarious state. Many people are struggling with unemployment or low paying jobs and are concerned about broader changes in the economy. These concerns demand a concerted response from governments and the international community. One step will be for G20 members to deliver on their commitment to refrain from imposing new trade-restrictive measures and roll back existing ones.”
The initiation of trade remedy investigations remained the most frequently applied measure by far, representing 72% of trade-restrictive measures and above the average share observed since 2009. The G20 economies initiated far more trade remedy actions (61) than were terminated (36) during the latest reporting period. Metal products (in particular steel), chemicals, and plastics and rubber account for the largest shares of anti-dumping and countervailing initiations during the review period.
On the positive side, the new trade-facilitating measures include those implemented in the context of the newly expanded Information Technology Agreement (ITA) and which have very broad trade coverage. The number of these measures does not provide a complete picture of the extent of these measures nor their impact, but WTO Secretariat estimates indicate that the ITA expansion measures which were implemented by certain members during the review period cover around US$ 375 billion in annual global trade.
The G20 economies are Argentina, Australia, Brazil, Canada, China, France, Germany, India, Indonesia, Italy, Republic of Korea, Japan, Mexico, the Russian Federation, the Kingdom of Saudi Arabia, South Africa, Turkey, the United Kingdom and the United States, as well as the European Union.
Key findings
- This sixteenth report on G20 trade measures for the reporting period between mid-May and mid-October 2016 has again outlined the persistent challenges faced by the international economy and for global trade.
- The latest reporting period shows a slight fall in the number of new trade restrictive measures being introduced at 17 per month – a total of 85 for the reporting period — compared to 21 measures per month in the last report.
- While this represents a reduction in the monthly figure compared to the peak in the previous period, it is actually a return to the trend level for new trade restrictions since 2009. The reduction in the monthly figure seen over this period should be placed in this broader context.
- The number of new trade-restrictive measures being introduced still remains worryingly high given continuing global economic uncertainty and the WTO’s downward revision of its trade forecasts, predicting 1.7% world merchandise trade volume growth in 2016, from its earlier forecast of 2.8%. If this revised forecast is realized, this would mark the slowest pace of trade and output growth since the financial crisis of 2009.
- Of the 1,671 trade-restrictive measures recorded for G20 economies since 2008, only 408 had been removed by mid-October 2016. The overall stock of measures has increased by 5.6% compared to the previous report – with the total number of restrictive measures still in place now standing at 1,263. The rollback of trade-restrictive measures recorded since 2008 remains too slow and continues to hover just below 25%.
- During the review period, G20 economies also applied 66 measures aimed at facilitating trade. At just over 13 new trade-facilitating measures per month, this represents a slight decrease over the previous report and remains below the 2009-2015 overall average trend. Trade-facilitating measures recorded by this report include the very first measures implemented in the context of the expanded Information Technology Agreement.
- The initiation of trade remedy investigations remained the most frequently applied measure, representing 72% of trade restrictive measures and above the average share observed since 2009. The G20 economies initiated more trade remedy actions than were terminated, 61 initiations versus 36 terminations.
- It is imperative that G20 economies — collectively and individually — re-double their efforts to deliver on their commitment to refrain from taking new protectionist measures and roll back existing ones. This is particularly the case given the recent reiteration by G20 Leaders of their opposition to protectionism on trade and investment in all its forms.
- G20 Leaders also need to work together to ensure that the benefits of trade are spread more widely and are better understood. A failure to make the case for inclusive trade could pave the way to increased protectionism in the future.
G20 trade-restrictive measures
(average per month)
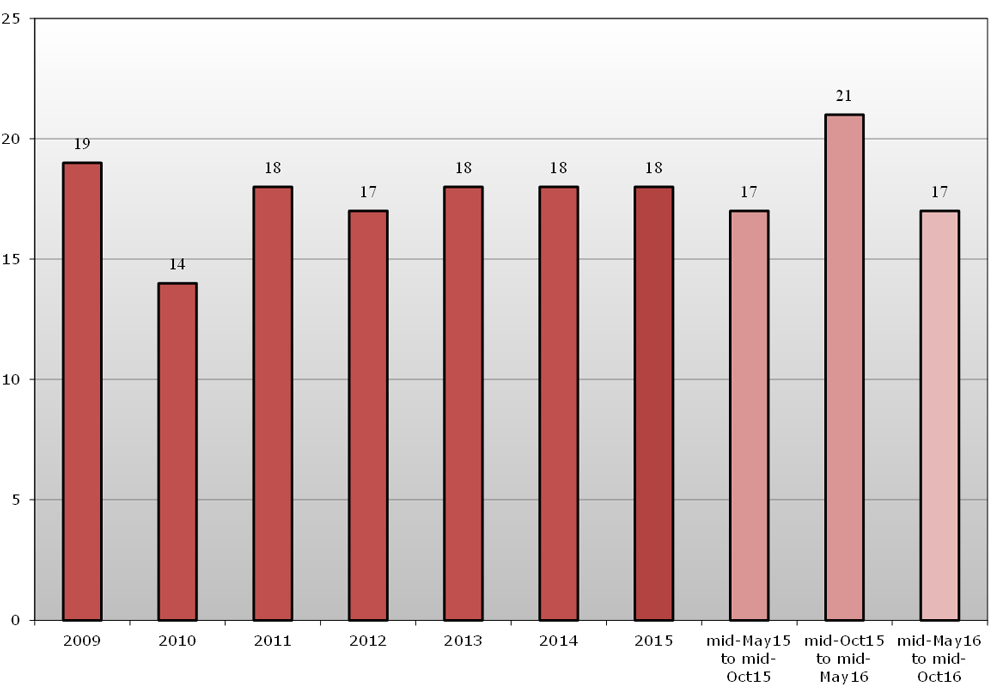
Note: Values are rounded.
Source: WTO Secretariat.
G20 trade-facilitating measures
(average per month)
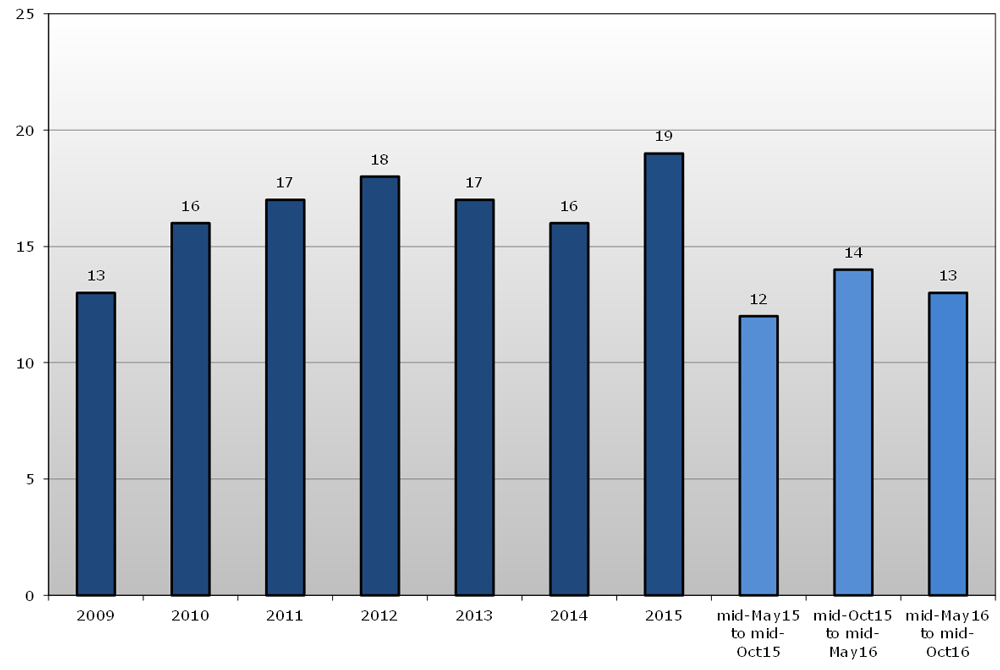
Note: Values are rounded.
Source: WTO Secretariat.
Stockpile of trade-restrictive measures
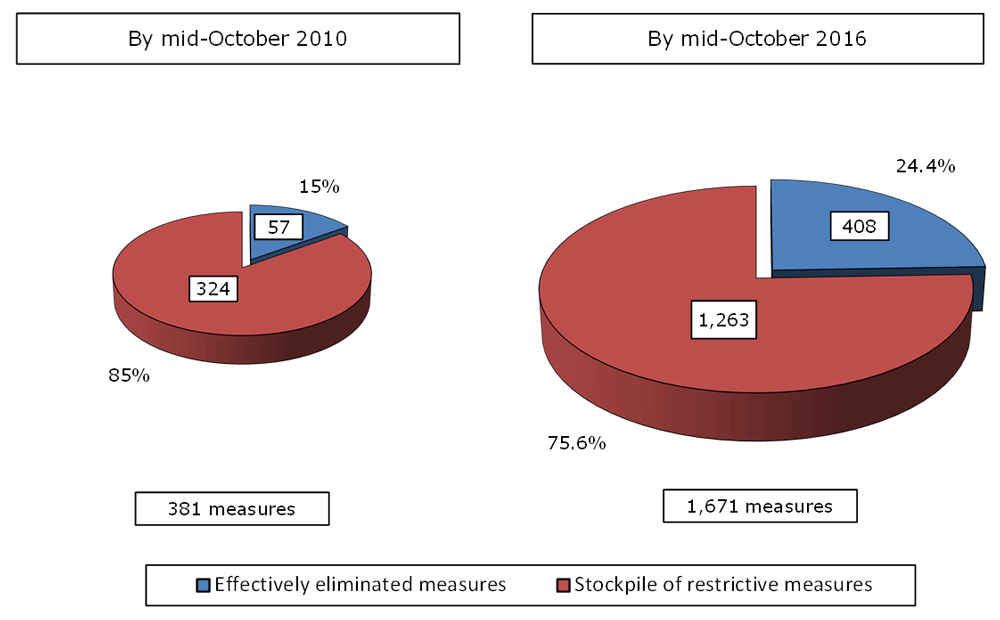
Note: Stockpile of restrictive measures includes measures listed in Annex 1.
Source: WTO Secretariat.
Executive Summary
This is the sixteenth WTO monitoring Report on G20 trade measures.1 It covers the period from 16 May to 15 October 2016.2
The Report has again outlined the persistent challenges faced by the international economy and for global trade. The overall stock of trade-restrictive measures continues to grow by roughly the same pace as identified in recent reports. Tangible evidence of G20 progress in eliminating older measures remains elusive as the share of restrictions which have been rolled back remains stable at less than a quarter of the total recorded.
The implementation of new trade-restrictive measures by G20 economies decreased over the period covered by this report. Since mid-May 2016, G20 economies applied 85 new trade‑restrictive measures — an average of 17 new measures per month, compared to almost 21 in the previous report. While this represents a reduction in the monthly figure compared to the peak in the previous period, it is actually a return to the trend level for new trade‑restrictive measures since 2009. The reduction in the monthly figure seen over this period should be placed in this broader context.
The number of new trade-restrictive measures being introduced still remains worryingly high given continuing global economic uncertainty and the WTO’s downward revision of its trade forecasts, predicting 1.7% world merchandise trade volume growth in 2016, from its earlier forecast of 2.8%. If this revised forecast is realized, this would mark the slowest pace of trade and output growth since the financial crisis of 2009.
Overall, the stockpile of restrictive measures introduced by G20 economies continues to grow. Of the 1,671 trade-restrictive measures (including trade remedies) recorded for G20 economies since 2008, only 408 had been removed by mid-October 2016. The total number of these restrictive measures still in place now stands at 1,263 — up by 5.6% compared to the previous report. This report confirms that G20 economies have maintained a rate of elimination of trade-restrictive measures, which is far too low to seriously reduce the overall stockpile of restrictive measures. Of the total number of trade-restrictive measures recorded for G20 members since 2008, roll-back has remained broadly stable at just below 25%.
Between May and October, G20 economies implemented 66 measures aimed at facilitating trade. At just over 13 trade-facilitating measures per month, this represents a slight decrease over the previous report and remains below the 2009-2015 trend. These measures include a number of import-liberalizing measures implemented in the context of the ITA Expansion Agreement with very broad trade coverage implications. The numerical counting of the trade measures does not provide a complete picture of the extent of these measures nor their impact, but Secretariat estimates indicate that the ITA expansion measures which were implemented by certain Members during the review period cover around US$375 billion. If trade remedies are excluded, G20 economies implemented slightly more trade-facilitating than trade-restrictive measures over the review period confirming the positive trend identified in the last report.
The initiation of trade remedy investigations remained the most frequently applied measure, representing 72% of trade restrictive measures and above the average share observed since 2009. The G20 economies initiated more trade remedy actions than were terminated, 61 initiations versus 36 terminations.3 The number of trade remedy investigations initiated by G20 economies per month is broadly in line with the last report and remains above the average reported in the October 2015 report. Metal products, and in particular steel products, chemicals, and plastics and rubber account for the largest shares of anti-dumping and countervailing initiations. Around 70% of G20 trade remedy investigations targeted products from other G20 members. In line with the findings of previous reports, anti‑dumping measures made up the overwhelming majority of trade remedy actions taken.
These trends in the implementation of new trade measures by G20 economies have to be considered against the background of uncertain world economy developments. World trade and output grew more slowly than expected in the first half of this year, prompting the WTO to revise downward its trade forecast for 2016 and 2017. The organization now expects world merchandise trade volume growth of 1.7% in 2016, down from an earlier estimate of 2.8%, accompanied by world GDP growth of 2.2% at market exchange rates. If the forecast for 2016 is confirmed, this would mark the slowest pace of trade and output growth since the financial crisis of 2009 and the first time in 15 years that the ratio of world trade growth to world GDP growth has fallen below 1:1. For the first time, a range of estimates has been provided for the coming year reflecting possible changes in the relationship between trade and output. World trade growth in 2017 is now expected to be between 1.8% and 3.1%, down from 3.6% previously.
Exports and imports of developing economies fell sharply in the first quarter before staging a partial recovery in the second as concerns about slowing economic growth in China eased and as commodity prices began to rise from recent lows. Meanwhile, exports and imports of developed economies stalled as economic activity slowed in North America. For the year-to-date, world trade has been essentially flat, with the average of exports and imports in Q1 and Q2 declining by 0.3% compared to the same period last year. Europe had the fastest import growth of any region in the first half (up 3% year-on-year) while South America had the weakest (down 11.8%). Even with the downward revision, risks to the forecast remain mostly on the downside. These include financial volatility stemming from changes in monetary policy in developed countries, the possibility that growing anti-trade rhetoric will increasingly be reflected in trade policy and the uncertainty about future trading arrangements in Europe following the Brexit referendum. In July, the WTO launched a new World Trade Outlook Indicator (WTOI), which is designed to provide “real time” information on trends in global trade and serve as an early-warning for global trade downturns. With a current reading of 100.9 for the month of August, the WTOI has risen above trend, signaling accelerating trade growth in November-December. This is the first update of the WTOI since its initial release in July, when the indicator stood at 99.0. The current WTOI reading is broadly consistent with the latest WTO trade forecast issued on 27 September, which foresaw world merchandise trade volume growth of 1.7% for 2016. The forecast noted flat trade growth in the first half of the year, which would have to be offset by stronger growth in the second half, which the WTOI reading captures.
Other observations of this report covered a range of subjects. G20 economies continued to show their commitment to notifying their Sanitary and Phytosanitary (SPS) measures, accounting for seven out of every ten notifications to the SPS Committee. Moreover, more than 60% of the specific trade concerns (STCs) discussed in the Committee addressed measures maintained by G20 economies. Similarly, the top ten WTO Members raising STCs were G20 members. In the area of Technical Barriers to Trade (TBT), G20 regulations continued to represent the majority of measures discussed in the TBT Committee. About 60% of new STCs and more than three-quarters of previously raised STCs concerned measures maintained by G20 economies.
Agricultural policies of G20 economies were the subject of the overwhelming majority of questions under the review process of the Agreement on Agriculture (AoA). During the review period, more than 80% of implementation-related issues discussed in the Committee were about policies implemented by G20 economies. Two-thirds of the new issues that were discussed related to domestic support policies. Several G20 members have recently made determined efforts to bring their agriculture-related notifications up-to-date.
A decrease in the number of new general economic support measures was recorded for G20 economies during in the review period. The main beneficiaries of such support included the agriculture sector with measures for dairy producers and a number of infrastructure programmes, including construction, information technology and digital infrastructure. Some programmes provided specific support to export-related activities or enterprises, including SMEs.
Important policy developments in the area of services were recorded during the review period and continued the trend of further liberalization in the trade in services sectors. Several services laws sought to strengthen and clarify relevant regulatory frameworks. A special box in this report is dedicated to a discussion on the strengthening of the ‘services-investment’ nexus.
This report draws attention to the changing technological landscape and to the increasing significance of intellectual property (IP) in economic development. G20 economies are at the forefront of this trend and several adopted new national and regional policies related to IP and the digital economy.
The OECD has contributed two topical boxes to this report. The first looks at the jobs that trade and Global Value Chains (GVCs) sustain domestically and globally. The second discusses the benefits from GVCs in enhancing export performance.
This Report has shown that it is imperative that G20 economies — collectively and individually — redouble their efforts to deliver on their commitment to refrain from taking new protectionist measures and roll back existing ones. This is particularly the case given the recent reiteration by G20 Leaders of their opposition to protectionism on trade and investment in all its forms.
G20 Leaders also need to work together to ensure that the benefits of trade are spread more widely and are better understood. A failure to make the case for inclusive trade could pave the way to increased protectionism in the future. – WTO
Notes:
1. The WTO trade monitoring reports have been prepared by the WTO Secretariat since 2009. G20 members are: Argentina; Australia; Brazil; Canada; China; European Union; France; Germany; India; Indonesia; Italy; Japan; Korea, Republic of; Mexico; the Russian Federation; the Kingdom of Saudi Arabia; South Africa; Turkey; the United Kingdom; and the United States. back to text
2. Unless otherwise indicated in the relevant Section.back to text
3. This report is without prejudice to the right of Members to take trade-remedy actions.back to text


