
World Trade Organization (WTO) economists have issued a strong upward revision to their forecast for 2017 trade expansion following a sharp acceleration in global trade growth in the first half of the year.
The estimate for growth in world merchandise trade volume in 2017 was raised to 3.6%. The previous estimate for 2017 was 2.4%, though this was set within a range of 1.8%-3.6%, reflecting the high level of economic and policy uncertainty. The new estimate puts the focus on the top end of that range. Growth of 3.6% would represent a substantial improvement on the lacklustre 1.3% increase in 2016. Reflecting the continued forecast risk arising from deep uncertainty about near-term economic and policy developments, the range of estimates for world trade growth has been adjusted to 3.2% – 3.9%. Stronger growth in 2017 was attributed to a resurgence of Asian trade flows as intra-regional shipments picked up and as import demand in North America recovered after stalling in 2016.
“The improved outlook for trade is welcome news, but substantial risks that threaten the world economy remain in place and could easily undermine any trade recovery,” WTO Director-General Roberto Azevêdo said. “These risks include the possibility that protectionist rhetoric translates into trade restrictive actions, a worrying rise in global geopolitical tensions and a rising economic toll from natural disasters.”
“Though difficult to quantify, these risks are very real. As a result, increased optimism about trade should be tempered with a healthy dose of caution. On the other hand, the fact that trade growth is now more synchronized across regions than it has been for many years could make the current expansion self-reinforcing. Such a positive outcome would be more likely if countries continue to resist the temptations of protectionism and work together with their partners in the multilateral system to ensure that gains from trade are both large and widely shared.”
The new estimate for world trade growth in 2017 is at the high end of the range of estimates provided in WTO economists’ most recent trade forecast of 12 April 2017 (1.8% – 3.6%). The strength of the revision is partly due to a modest improvement in the consensus forecast for world GDP growth (2.8% in 2017 at market exchange rates, up from 2.3% in 2016) and partly due to the composition of that growth.
GDP growth accelerated in most major economies in the second quarter, most notably in China where quarter-on-quarter growth rose from 1.3% in Q1 (equivalent to an annual rate of around 5.3%) to 1.7% in Q2 (around 7.0% annualized). Growth also strengthened in the United States from 1.2% annualized in Q1 to 3.0% in Q3) and the euro area (from 2.2% in Q1 to 2.6% in Q2).
Stronger growth particularly in China and the United States boosted demand for imports, which spurred intra-Asia trade as demand was transmitted through regional supply chains. Chinese demand in the first half of 2017 was driven by solid growth in industry (up 6.4% in real terms for the year to date) and even stronger growth in services (up 7.7% over the same period). Financial conditions in Asia also improved compared to the volatile first quarter of 2016, contributing to business and consumer confidence.
The partial recovery of oil prices in 2017 also appears to have provided some support for investment in the United States, growth of which slowed abruptly in 2016 – particularly in the energy sector – but has picked up in the first half of this year. The import content of investment tends to be higher than other components of GDP, so a recovery of expenditure in this area would be expected to have an outsized impact on import demand.
The rapid pace of trade growth in 2017 is unlikely to be sustained next year for a number of reasons. First, trade growth in 2018 will not be measured against a weak base year, as is the case this year. Second, monetary policy is expected to tighten in developed countries as the Federal Reserve gradually raises interest rates in the United States and the European Central Bank looks to phase out quantitative easing in the euro area. Third, fiscal expansion and easy credit in China are likely to be reined in to prevent the economy from overheating. All of these factors should contribute to a moderation of trade growth in 2018 to around 3.2% (the full range of the estimate being from 1.4% to 4.4%).
Chart 1: Merchandise exports and imports by level of development, 2012Q1-2017Q1
(Volume index, 2012Q1=100)
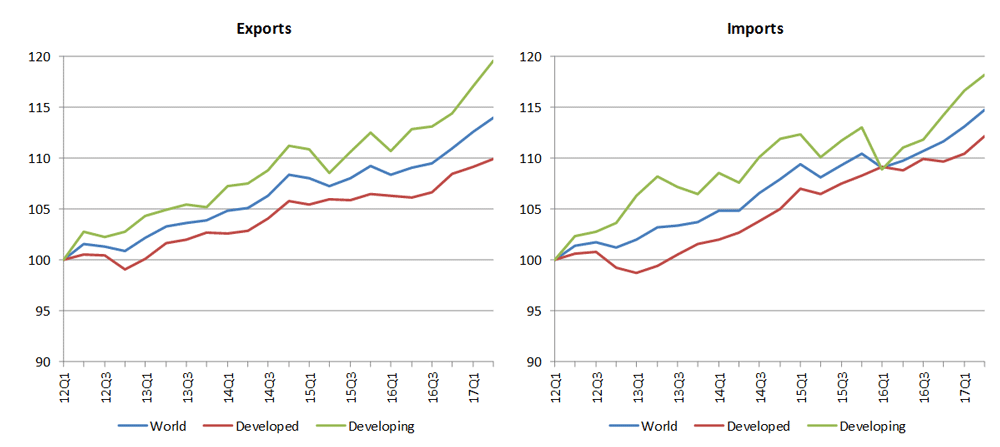
Source: WTO Secretariat.
Charts 1 and 2 show seasonally adjusted merchandise export and import volumes by level of development and by geographic region. World trade rose 4.2% year-on-year in the first half of 2017 compared to the same period in the previous year. Developed economies’ exports were up 3.1% over the same period while those of developing economies were up 5.9%. Meanwhile, imports were up 2.1% in developed countries and 6.9% in developing economies in the first half of the year.(1)
Exports and imports were up in the first half of 2017 compared to the same period last year in all regions tracked by WTO short-term trade statistics except for South America, where trade was essentially flat. North American exports and imports were up 4.9% and 3.9% year-on-year during this period. Exports of South America were down 0.7% while imports were up 1.0%. In Europe, exports grew 2.6% while imports rose 1.2%. Exports of Asia rose 7.3% while the region’s imports jumped 8.9% thanks in large part to strong increases in China.
“Other regions”, comprised of Africa, the Middle East and the CIS region, saw flat export growth of 0.1% in volume terms mostly due to the fact that demand for oil and other natural resources tends to be very stable. On the other hand, imports of these regions were collectively up 2.5% thanks to a partial recovery in prices for primary commodities. Oil prices were up 21.8% year-on-year in the first half of 2017, boosting export revenues of resource producing regions. However, prices remain low by recent historical standards, with Brent Crude at $53.25 per barrel on 11 September, well below the $100 per barrel that prevailed before July 2014.
Chart 2: Merchandise exports and imports by region, 2012Q1-2017Q1
(Volume index, 2012Q1=100)
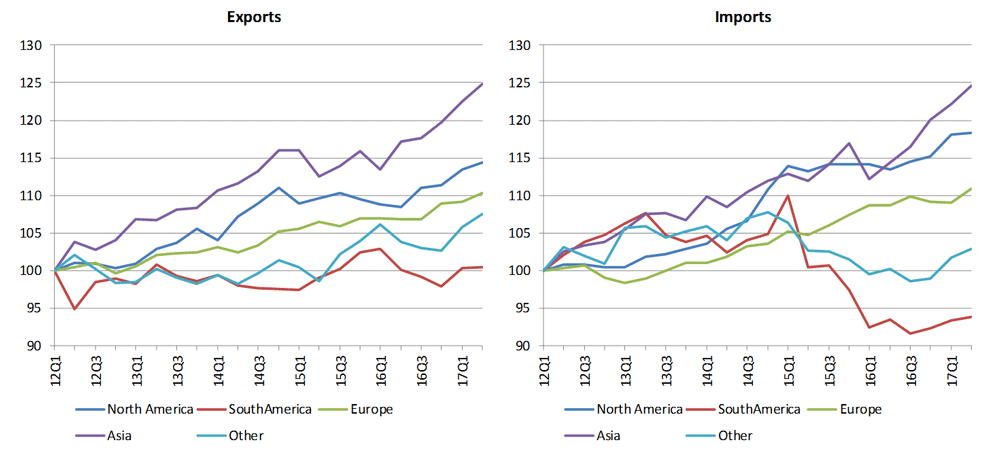
Source: WTO Secretariat.
These data are in line with the WTO’s World Trade Outlook Indicator (WTOI), which switched from signalling below-trend growth in July 2016 to above-trend growth in November 2016 and has continued to strengthen since then. The WTOI combines several leading indicators for trade into a single composite indicator. Components include container port throughput, air freight shipments, export orders, automobile sales and trade in electronic components and raw materials.
Table 1 summarizes the WTO’s revised trade forecasts for 2017 and 2018. If these estimates are realized, 2017 will see developing economies outpace developed economies in trade volume growth on both the export and import sides. It will also be the first year since 2013 in which imports of developing economies will have grown faster than those of developed countries.
Whether this rebound marks an end to the so-called emerging market slowdown remains to be seen. A robust Chinese economic recovery has boosted import demand and stimulated trade between China and its Asian trading partners in 2017, but the pace of Chinese growth is expected to moderate progressively in 2018 and beyond. Meanwhile, other developing regions continue to stagnate. On a bright note, Brazil should see growth in its imports and GDP turn positive in 2017 but South America as a whole will continue to register weak trade and GDP growth.
Trade growth for 2017 has been revised upward for North America on both the export side (from 3.2% to 4.2%) and import side (from 3.0% to 4.1%) while estimates have been scaled back for European exports (from 2.8% to 2.5%) and imports (from 2.9% to 2.4%). The biggest upgrades were for Asia, which should see its exports and imports advance to 7.0% and 6.7%, respectively, in 2017. Previous estimates (2.5% for exports and 3.2% for imports) suggested a further weakening of the relationship between world trade and GDP but this seems to have been premature. The ratio of world trade growth to world GDP growth, referred to by economists as the “elasticity” of trade, should rebound to 1.3:1 in 2017 (see Chart 3).
Table 1: Merchandise trade volume and real GDP, 2013-2018 a
Annual % change
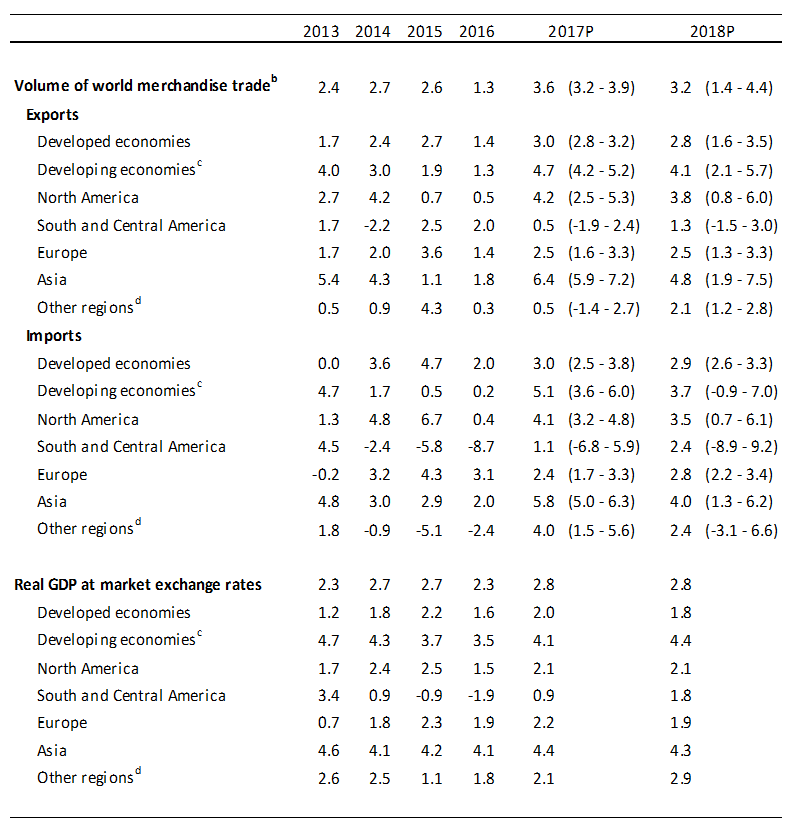
a Figures for 2017 and 2018 are projections.
b Average of exports and imports.
c Includes the Commonwealth of Independent States (CIS), including associate and former member states.
d Other regions comprise Africa, Middle East and Commonwealth of Independent States (CIS).
Sources: WTO Secretariat for trade, consensus estimates for GDP.
A range of values have been provided around central estimates for 2017 and 2018 to reflect the uncertainty inherent in trade forecasts. World trade growth for 2017 could be as high as 3.9% or as low as 3.2% once complete data for the year are available. (Note: Ranges are based on the central estimate plus or minus the mean absolute deviation between historical forecasts and actual values, plus an adjustment to account for over/underestimation in previous years.)
Chart 3: Ratio of world merchandise trade volume growth to world real GDP growth, 1981-2017
% change and ratio

Sources: WTO Secretariat for trade, consensus estimates for GDP.
Risks to the forecast are firmly tilted to the downside. Anticipated shifts in the stance of monetary policy in developed countries could provoke large changes in prices and exchange rates that would strongly influence international trade patterns. Renegotiation of the North American Free Trade Agreement (NAFTA) and negotiation of post-Brexit trade arrangements between the United Kingdom and the European Union could also unsettle global and regional trade. Rising geopolitical tensions, most notably in Asia, could have extremely negative consequences for the world economy that would be difficult to gauge in advance. Finally, natural disasters including hurricanes in the United States could have a significant but temporary impact on trade in the short-run.
Over the longer term, the rebalancing of China’s economy away from manufacturing and toward services may weigh on global import demand for some time. Services, which give rise to lower demand for imports than manufacturing, have seen their share in Chinese value added rise from 43% in 2008 to 54% today. Although this rebalancing may cause Chinese imports to moderate, these changes should promote stronger and more sustainable growth in the long run.
Figures above refer to merchandise trade in volume terms, but trade in current US dollar terms is also up in 2017. Chart 4 shows merchandise exports and imports of selected economies, which are up to varying degrees. Trade in commercial services is also up in most major economies other than the United Kingdom, which saw the dollar value of exports and imports fall 5.2% and 6.8%, respectively. However, nominal trade statistics should be interpreted with caution as they are often strongly influenced by prices and exchange rates.
Chart 4: Merchandise exports and imports of selected economies, July 2014-March 2017
(Year-onyear percentage change in current dollar values)
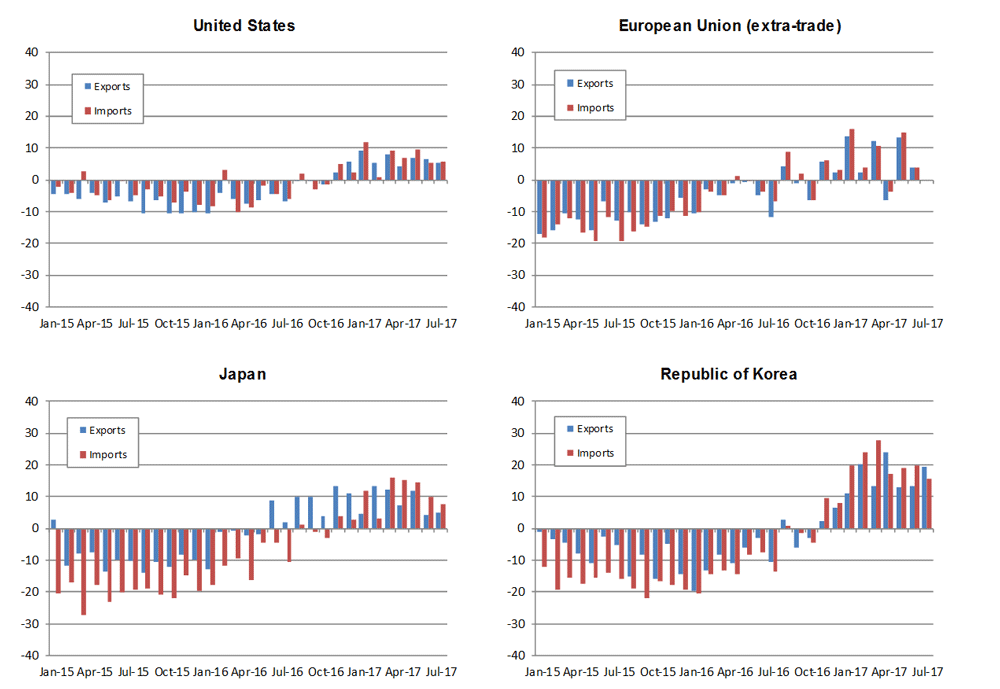
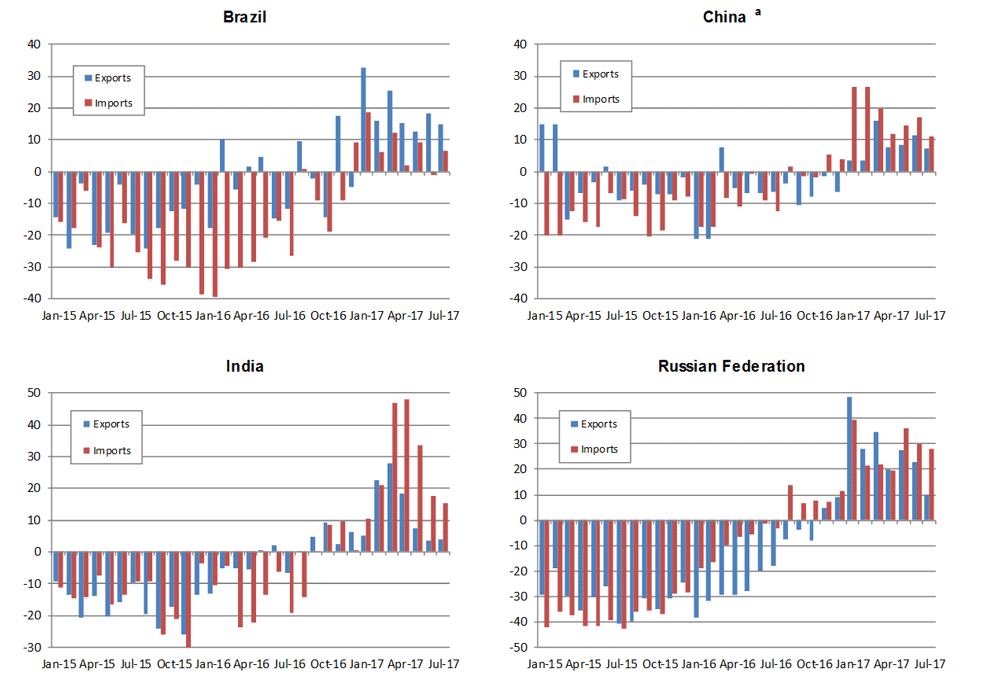
a) January and February average to minimize distortions due the lunar new year
Source: IMF International Financial Statistics, Global Trust Information ServicesGTA database, national statistics.


